OCTOBER 2022 MARKETWATCH
Thursday Oct 13th, 2022

In this edition of tempo, you will notice that we saw an uptick in the market for the month of August here in the Durham Region. The volume of sales increased, while our new listing inventory was lower than in July. The average price rose slightly in every category of detached, freehold homes, with beautiful, well-presented, properly priced properties experiencing multiple offer scenarios, many with competing offers counting into the teens. Houses took longer to sell but ultimately sold for a bit more money than the previous month. Driving this mini flurry of activity was the pressure on many buyers to solidify a purchase prior to the next rate hike in September.
As we shift into a balanced market by way of a roller coaster ride – with the government and other outside economic forces at the controls -- it is vital to understand the changing landscape in both the arena of real estate and in the behaviour of buyers, sellers and agents alike.
The final sale price of a property is far and away the biggest and best indicator of what is really happening out there. “Percentage over asking” is relative only to the extent of what pricing strategy was employed in the first place ( was the property drastically undervalued to begin with or was it priced at true market value?). Do “days on market” really matter if the listing for the property has been terminated and re-listed several times, skewing the data so that the actual reporting is no longer a true measure of time? Do extreme bidding wars count if 99% of the offers aren’t in line value-wise or even worth the paper they are written on?
These factors are now playing significant roles in our marketplace, but so many buyers and sellers have no idea how to determine the truth from the fiction from the irrelevant, let alone navigate a course forward that is in their best interests. Our mission is to educate you fully, so that upon viewing the data, you can process the information and conclude for yourself what is best.
Thank you for being our client, for trusting us with some of the most important decisions you will ever make. We promise to invest our time and energy, experience and knowledge into you, so that you can make the right investment into the real estate market.
The Month of August in Review
In August, the Durham Region Association of REALTORS reported 806 residential sales in the Durham Region, down 23% from the 1,048 sales of August 2021, but up 15% over July 2022, when just 700 sales were reported. Year-to-date, our sales volume is down 30% compared to 2021, with 7,665 homes selling so far this year.
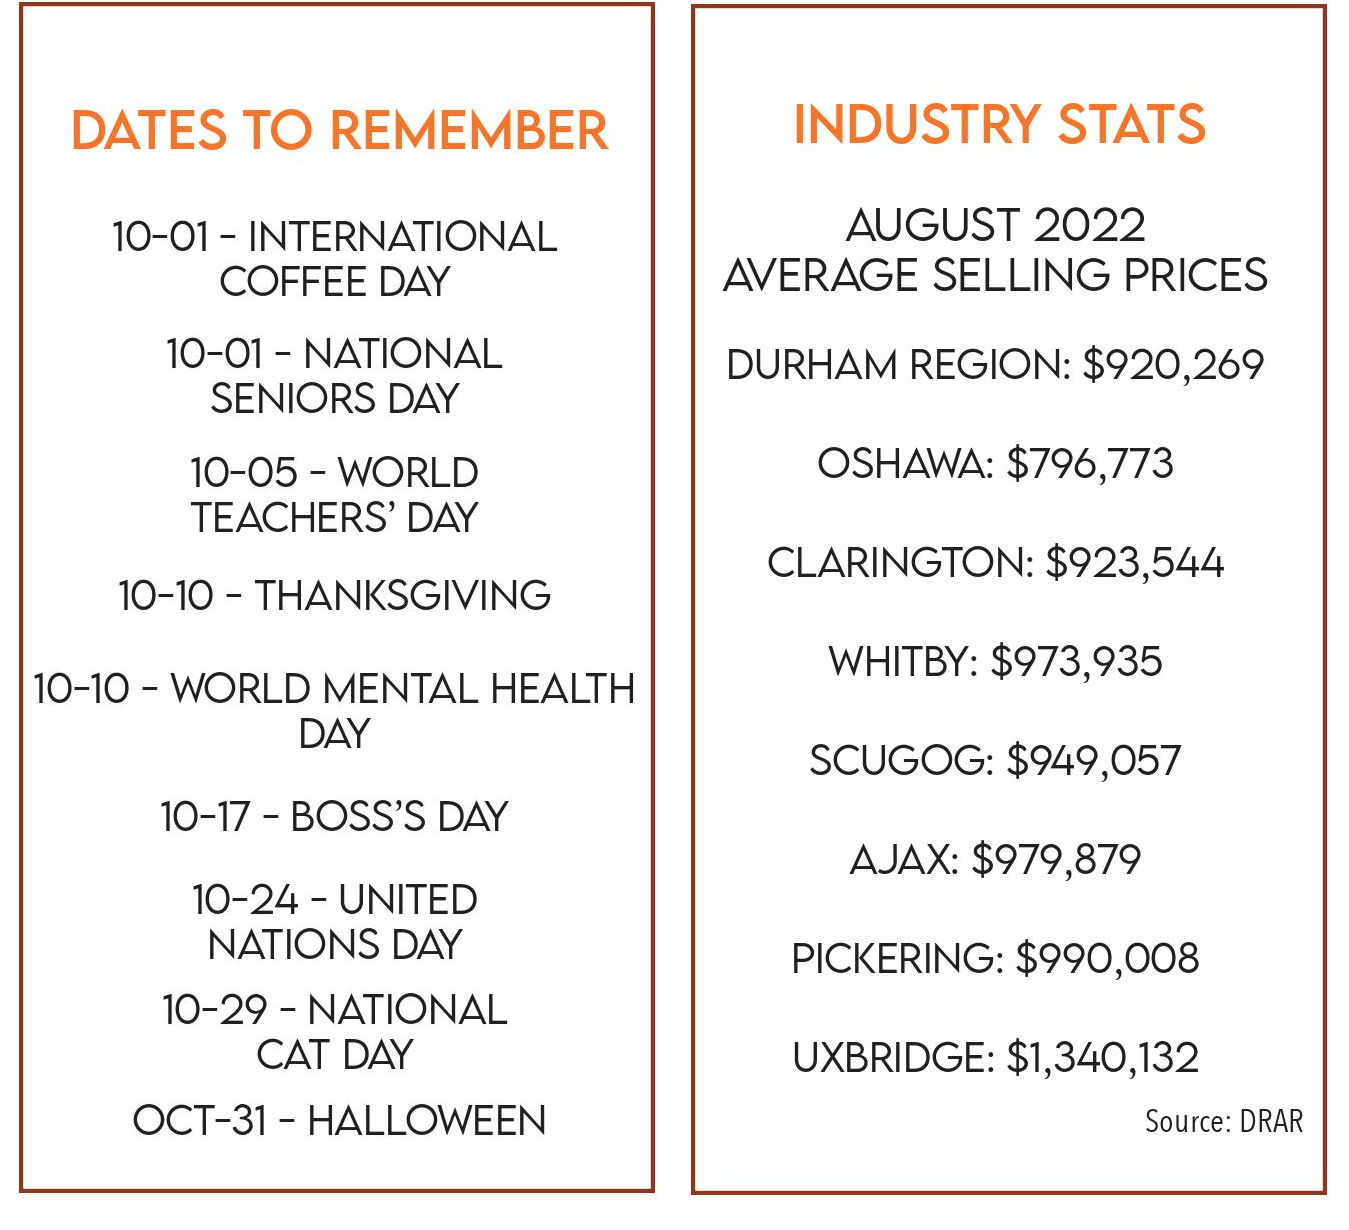
The average selling price in the Durham Region for the month of August was $920,269, up 2% from July when we saw an average of $901,412, and not far off of the August 2021 average of $918,133. August 2022 represents the fourth consecutive month where the average sale price has fallen below the one million dollar mark. We don’t believe that the slight increase in the average price over the previous month is a sign of recovery; rather, we believe this is a blip -- a response from buyers seeking to purchase before the September rate hike. Regardless, these monthly averages still represent very impressive numbers for the Durham Region when viewed in the context of our historical monthly averages over the past decade: in 2012, the average selling price in the Durham Region was $335,991. Even in August of 2020, the average home was selling for just $734,136, so comparatively, we are still enjoying tremendous gains. Year-to-date, the average sale price of all residential real estate sold in the Durham Region is $1,061,986, up 18% from 2021.
The amount of new listing inventory coming onto the market in August was 1,275 units, down 13% from the 1,461 new listings in the previous month. Comparatively, we are up 9.5% from the same period the year before, which saw 1,167 new listings enter the market. Year-to-date we are basically on par in listings taken – just 33 more than the 2021 numbers. Year-to date, we have seen 14,283 properties enter the market through the MLS system in Durham Region.
The average days on market for August 2022 was 17 days The average days on market, year-to-date, sits at 10.
The average Sale Price to List Price Ratio (SP/LP) for all properties sold in August was 100%. Year-to-date, the average SP/LP is 114%.
The current Months of Inventory factor dropped just slightly in August to 1.4, but is still continuing the trend of more reasonable numbers than what we were seeing this time last year. The Sales to New Listing Ratio (SNLR) for the month of August was 63.2%, just slightly out of market balance and into favourable sellers territory, illustrating how strong the market remained for sellers. Typically, ratios between 40% and 60% reflect market balance, with anything below that range suggesting a market that benefits buyers and anything above it, a market that benefits sellers. This time last year, the SNLR was sitting at 89.8% with the Months of Inventory factor at a negligible .5.
The Durham Region saw a dollar volume in sales of $741,736,706 in August -- making the year-to-date total 18% lower than the previous year-to-date for 2021. Oshawa once again led the way, with a volume of almost $189 million, making Oshawa’s total 18% lower year-todate than 2021, but its average sale price still up 19% year-to-date over 2021. Whitby placed an honourable second at almost $153 million, down 14% year-to-date from 2021 but up 18% year-to-date in average sale price. Clarington posted $141 million, with a year–over-year decrease of 16% but an average sale price increase of 17% year-to-date. We expect to see the year-over-year margins on average sale prices across all of our communities in the Durham Region continue to shrink.
As always, we have included below a snapshot of performance of the overall market in Durham Region for the month.
For a more specific look at your community, your neighbourhood and your housing style, just call us. We are always available to update you personally on current statistics and inventory, and how they are affecting your home’s value.
HERE’S THE AVERAGE PRICE BREAKDOWN FOR AUGUST:
The average detached dwelling sold for $1,012,181 at 99% of list price in 17 days. 542 units sold.
The average semi-detached dwelling sold for $772,517 at 104% of list price in 14 days. 63 units sold.
The average link dwelling sold for $788,900 at 100% of list price in 12 days. 15 units sold.
The average freehold townhouse sold for $809,189 at 102% of list price in 14 days. 89 units sold.
The average condominium apartment sold for $552,448 at 98% of list price in 21 days. 44 units sold.
The average condominium townhouse sold for $685,033 at 102% of list price in 16 days. 53 units were sold.
HIGHER INTEREST RATES WEIGH DOWN ON CANADA’S HOUSING MARKETS: RBC Economics, Robert Hogue
The cooling trends that emerged this spring are still firmly in place across Canada’s housing markets. Early reports from local real estate boards for the most part showed both resale activity and prices continuing to soften in August. Toronto and Hamilton however saw a modest monthly resales increase—which we think is nothing more than volatility around the (clearly downward) trend. The fact remains that the majority of markets in Ontario, British Columbia and Quebec operate well below pre-pandemic levels at this stage. Easing demand-supply conditions and souring sentiment are fueling the price correction. They provide buyers with a stronger hand in negotiations, helping them to reverse some of the enormous appreciation that occurred during the pandemic. This process is most visible in the suburbs and exurbs of Toronto and Vancouver where price drops have been most significant to date.
Rising interest rates are pushing many buyers to the sidelines and reducing the purchasing budget of others. Our expectations for the Bank of Canada to hike its policy rate to 3.5% by the fall will keep chilling markets in the months ahead. We see the downturn intensifying and spreading as buyers take a wait-and-see approach while ascertaining the impact of higher lending rates. Canada’s least affordable markets Vancouver and Toronto, and their surrounding regions, are most at risk in light of their excessively stretched affordability and outsized price gains during the pandemic.
Toronto area—Buyers haven’t given up The market took a breather from the steep drop in activity since spring. Home resales in fact rose 11% between July and August on a seasonally adjusted basis—though still remained well below pre-pandemic levels. While it’s too early to call it a bottom, we view it as evidence buyers haven’t given up and are ready to pull the trigger on the right opportunity. Price corrections may provide more opportunities. Toronto’s composite MLS HPI fell for the fifth-straight month, down another 2.8% (-$32,900) to $1.12 million. Since the March peak, the index has lost almost 16% in value or more than $210,000. Suburban single-detached home prices have seen the biggest declines, especially in the Halton and Durham regions. Condo prices, however, have been more resilient. We expect these diverging trends to persist near term as buyers focus on relatively more affordable options such as condos.

Post a comment