SEPTEMBER 2022 MARKETWATCH
Tuesday Aug 30th, 2022

While this month’s edition may read a little “doom and gloom”, bear in mind that the summer market is always slower than the rest of the year, and our statistical analysis is reflective of what happened for the month of July -- a notoriously quieter month on the resale calendar. That, coupled with rising interest rates, out of control inflation and a new tentativeness in the buyer psyche, equals a very changed landscape in the world of real estate. Once the kids are settled back into their regular school routine, we should see a slight uptick in the housing market, with more sales and higher levels of inventory.
The massive gains of the first quarter are aging into a historic and brief anomaly in our marketplace, the likes of which we may not see again, nor in such a robust fashion, for a long time. Gains enjoyed over the course of the pandemic and specifically during the lockdown periods are being eroded daily as clearer heads prevail and the fear-of-losing-out mentality wanes in the buyer pool. More than one economic forecaster is predicting a return to pre-pandemic prices before the end of 2023, which means we still have a long way to fall. While inventory remains somewhat tight, and the housing shortage has in no way been resolved, a more reasonable pace of sales has developed and the listings-to-sales ratio is leveling out nicely. Terms like “normal”, “balanced” and “fair” are being used to describe the conditions at work now --the kind of market conditions we experienced prior to the pandemic for many many years.
In real estate, September can be somewhat of a transitional month, where activity picks up in the later weeks. It’s a month that requires strategy to navigate, especially if a move is planned for late fall or early winter. There’s a great window of opportunity for about 6 weeks each autumn, but each year it looks slightly different and the season overall can be fickle, just like Mother Nature! If you, a friend or a loved one has made plans to move in the next few months or into early 2023, now is the time for a confidential appointment with us to discuss a game plan that serves your best interests and capitalizes on our insider knowledge, to net you the most money in the least amount of time possible.
This is not a time for real estate amateurs or a market for the inexperienced. Trust our team -- the #1 brokerage in Durham Region for the past decade – to work for YOU. Our Business is Your Business.
The Month of July in Review
In July, the Durham Region Association of REALTORS reported 700 residential sales in the Durham Region, down 27.5% from June, when 967 sales were reported, and down 36.5% from the 1,104 sales of July 2021. Year-to-date, our sales volume is down 31% from 2021, with 6,863 homes selling so far this year
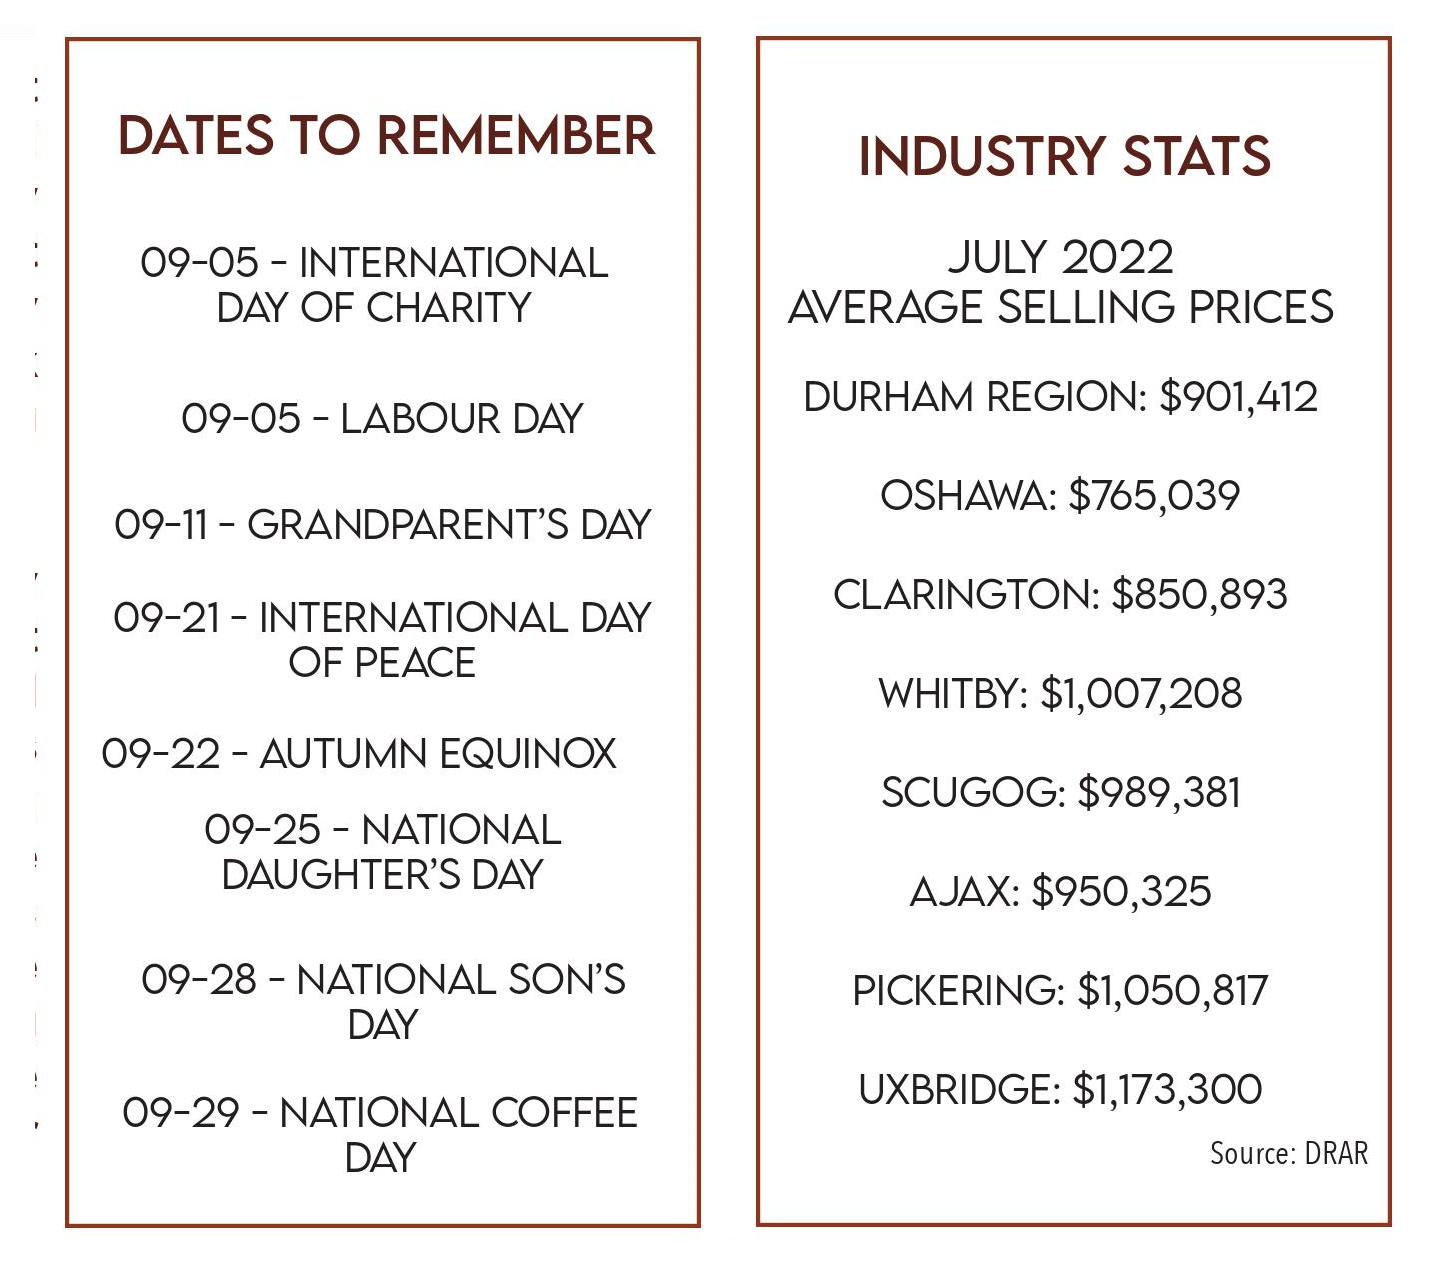
The average selling price in the Durham Region for the month of July was $901,412. June saw an average of $969,424 so July is down approximately $68,000 or 7%. Year-over-year, July dropped negligibly from the $910,197 average sales price in July 2021; just $8,785 or less than 1%. July 2022 represents the third consecutive month where the average sale price has fallen below the one million dollar mark, and establishes a very clear pattern of downward trending average sale prices, five months running. From our peak in February 2022 of $1,228,990, we have slid month over month, totaling a 26.5% loss or $327,587. It is, nonetheless, still a very impressive number for the Durham Region when viewed in the context of our historical monthly averages over the past decade.
The amount of new listing inventory coming onto the market in July was 1,461 units -- down 26% or 518, from the 1,979 units in June but up 14% from July 2021 when just 1,280 new listings entered the market. Year-to-date we are down 1% in the number of listings coming onto the market compared to 2021. These numbers are a little misleading however, as they do not account for the large amount of terminations and suspensions of property, and then the re-listing of same, that we are currently witnessing.
The average days on market for July rose to 15 days. The average days on market, year-to-date, sits at 9. The average Sale Price to List Price Ratio (SP/LP) for all properties sold in July was 101%. Year-to-date, the average SP/LP is 116%.
The current Months of Inventory factor rose again in July, peaking at 1.9 – a more reasonable number than what we have been seeing over the past two years. The Sales to New Listing Ratio (SNLR) for the month of July was a very balanced 48% -- a new trend towards stabilization and market balance seemingly in the works. Typically, ratios between 40% and 60% reflect market balance, with anything below that range suggesting a market that favours buyers and anything above it, a market that benefits sellers. This time last year, the SNLR was sitting at 86% with the Months of Inventory factor at a negligible .5. How times have changed!
The Durham Region saw a dollar volume in sales of $630,988,386 in July -- making the year-to-date total 17% lower than the previous year-to-date for 2021. Oshawa once again led the way, with a volume in excess of $158 million, making Oshawa’s total 18% lower year-to-date than 2021, but its average sale price still up 21% year-to-date over 2021. Whitby placed an honourable second at almost $121 million, down 15% year-to-date from 2021 but up 20% year-to-date in average sale price. Clarington posted almost $117 million, with a year–over-year decrease of 15% but an average sale price increase of 19% year-to-date. We expect to see the year-over-year margins on average sale prices across all of our communities in the Durham Region continue to shrink.
As always, we have included below a snapshot of performance of the overall market in Durham Region for the month. For a more specific look at your community, your neighbourhood and your housing style, just call us. We are always available to update you personally on current statistics and inventory, and how they are affecting your home’s value.
HERE’S THE AVERAGE PRICE BREAKDOWN FOR JULY:
The average detached dwelling sold for $977,364 at 101% of list price in 15 days. 490 units sold.
The average semi-detached dwelling sold for $797,454 at 103% of list price in 14 days. 41 units sold.
The average link dwelling sold for $785,833 at 105% of list price in 11 days. 12 units sold.
The average freehold townhouse sold for $810,196 at 101% of list price in 14 days. 70 units sold.
The average condominium apartment sold for $544,124 at 99% of list price in 24 days. 38 units sold.
The average condominium townhouse sold for $662,063 at 101% of list price in 13 days. 48 units were sold.
Source: DRAR

Post a comment